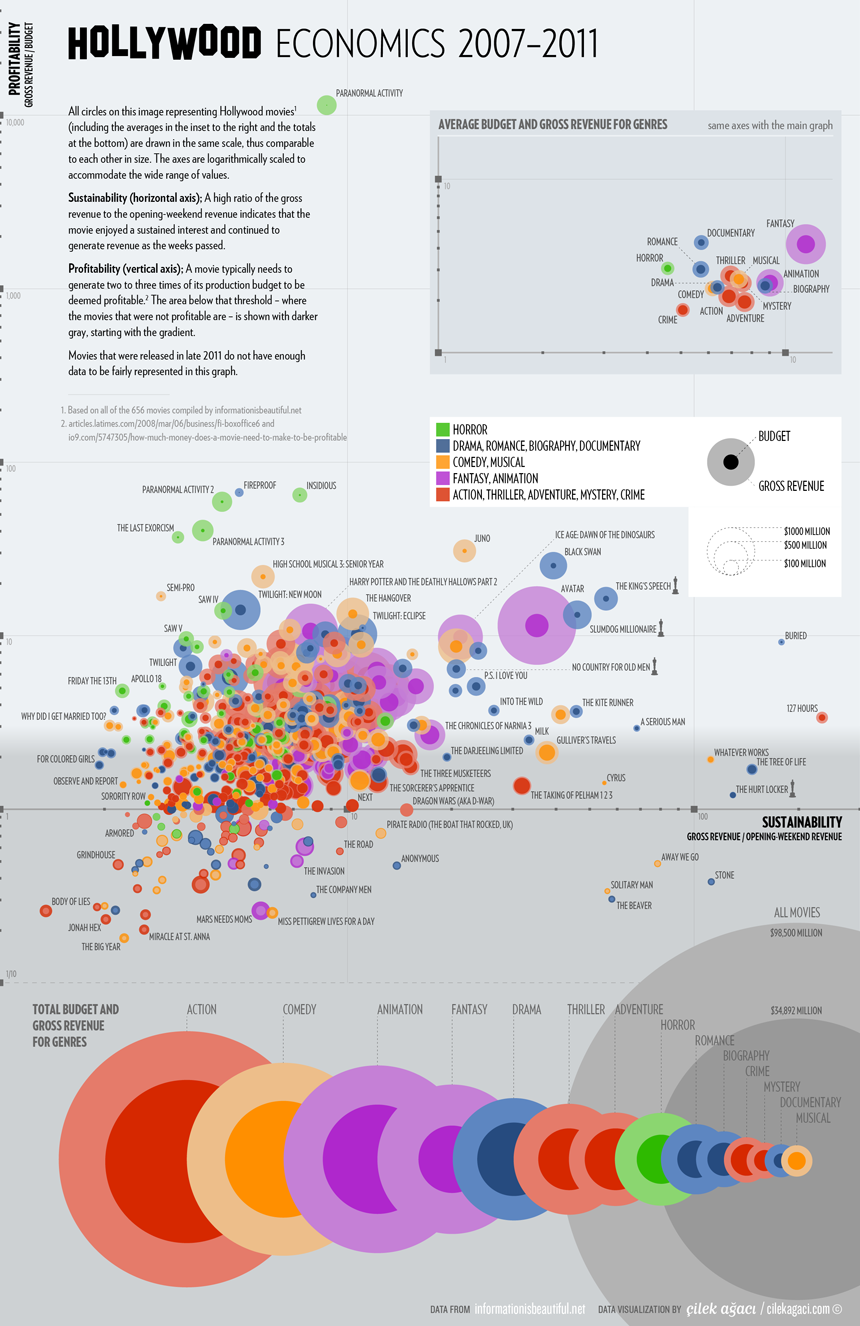
Hollywood Economics
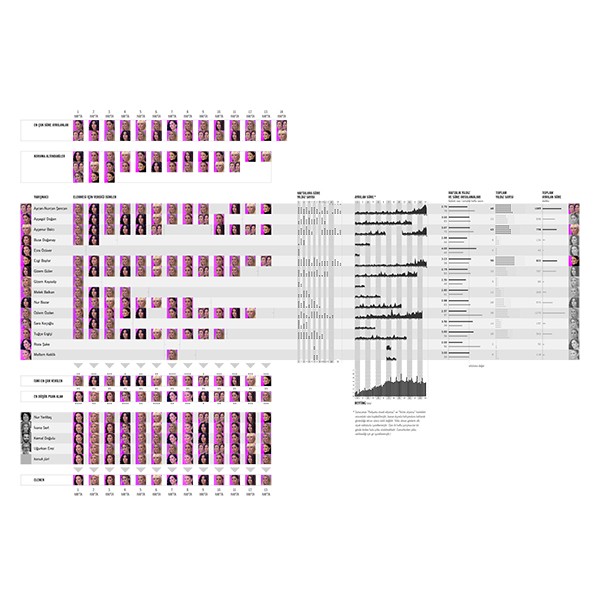
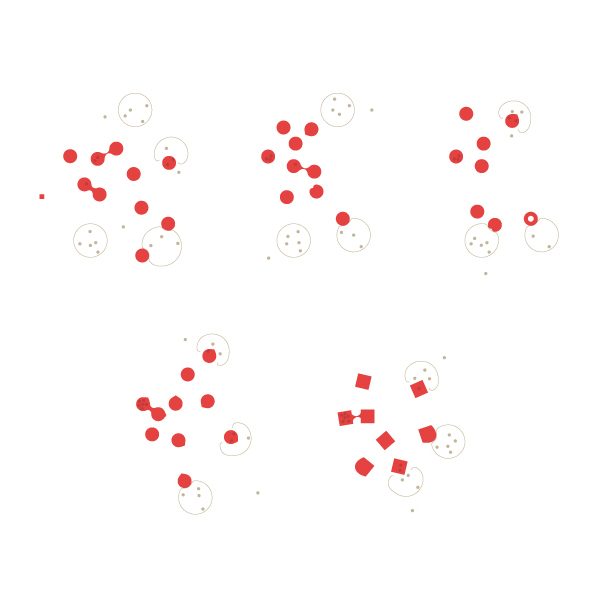
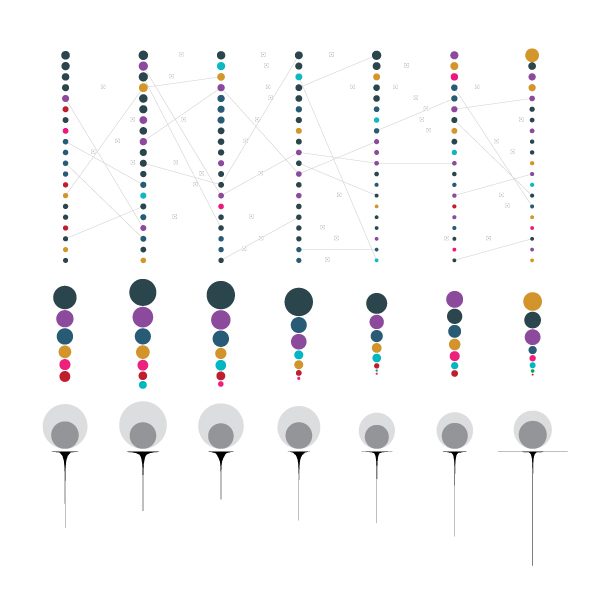
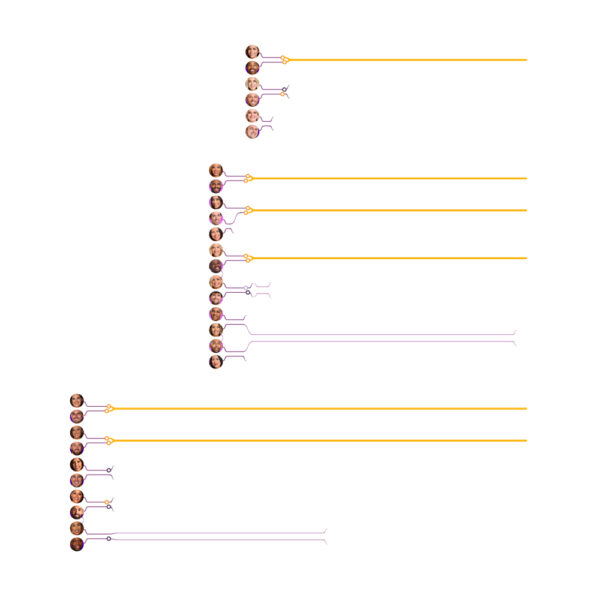
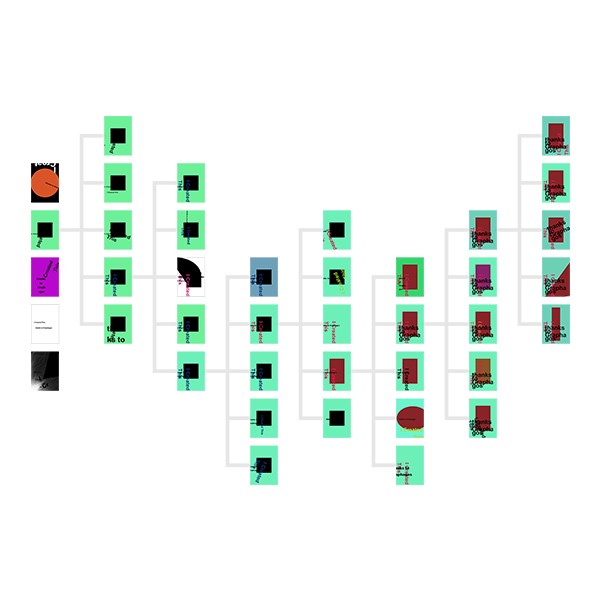
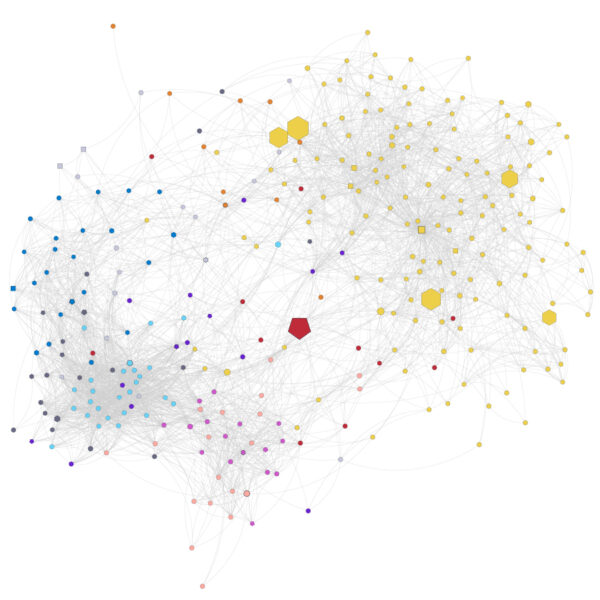
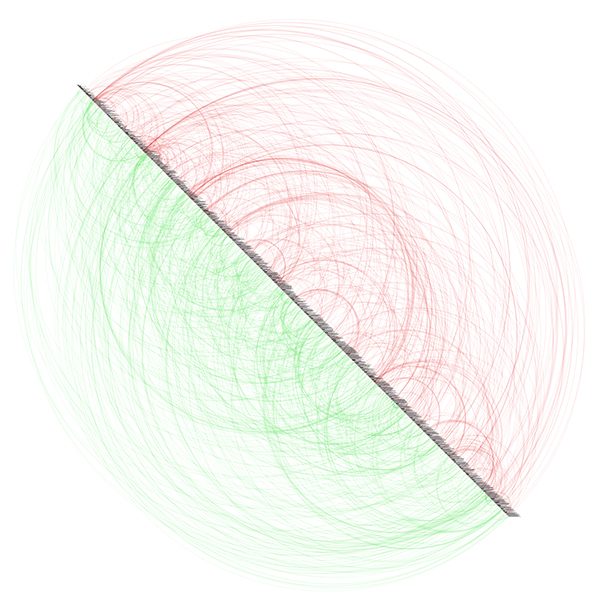
In January 2012, The Information is Beautiful Awards launched a data visualization challenge for Hollywood films from 2007–2011, providing an “ultra-comprehensive dataset that lifts the lid on opening weekends, worldwide gross, budgets, storylines, review scores – everything – for every Hollywood film released in the last five years.” This is our (Çilek Ağacı’s) submission which was shortlisted along with eleven others. For each element (movie or genre), we visualize five values (budget, gross revenue, profitability, sustainability, genre) via different visual parameters. Read more about it here.
Buy
Buy